Clara Wolf · 24 September 2026
Decoding Barometric Pressure Shifts to Predict Sudden Weather Changes at Sea
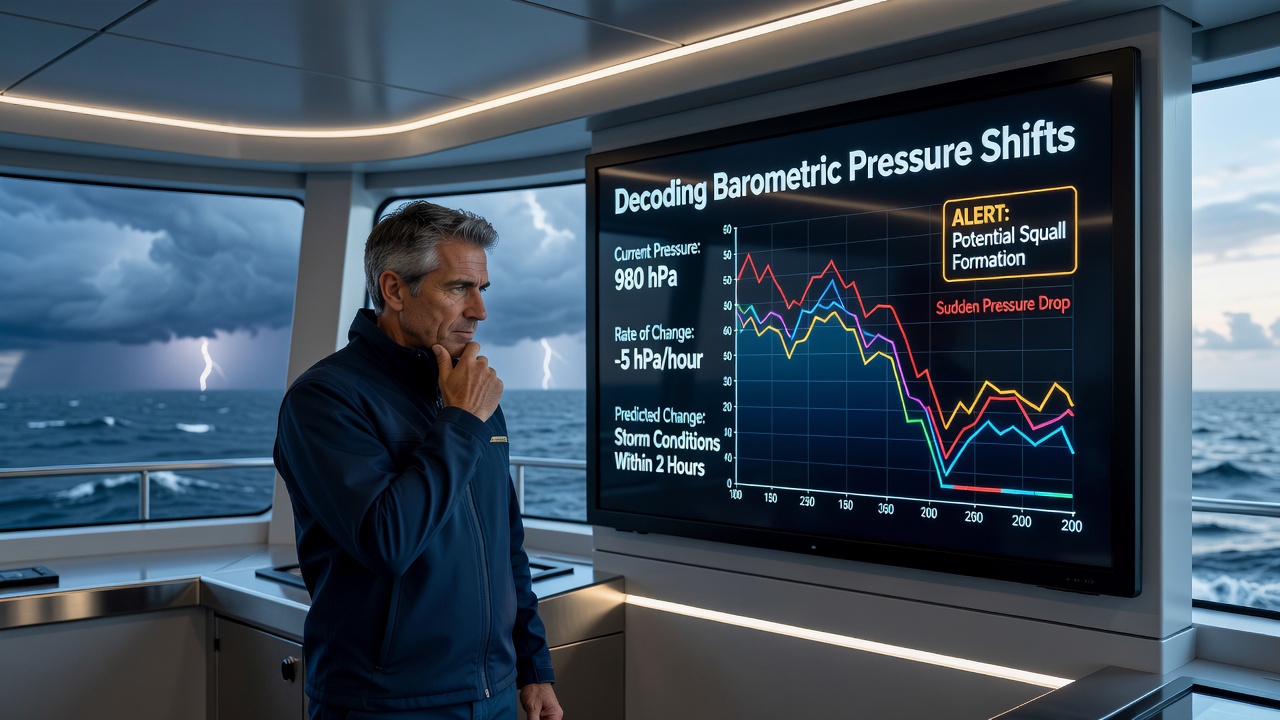
Barometric pressure serves as a primary indicator for mariners tracking atmospheric conditions over open water, where sudden shifts often precede rapid weather alterations that affect vessel stability and route safety. Researchers have documented how pressure readings, when interpreted alongside wind patterns and sea state data, provide advance signals of approaching fronts or localized disturbances that standard visual observations might miss. Data from marine weather stations shows these changes occur on timescales ranging from minutes to hours, giving crews limited windows to adjust sails or seek shelter.
Fundamentals of Atmospheric Pressure at Sea
Atmospheric pressure results from the weight of air columns pressing down on the ocean surface, and its measurement in millibars or hectopascals forms the basis for many forecasting models used by commercial shipping and recreational fleets alike. A standard sea-level reading hovers near 1013 millibars, yet deviations signal broader circulation shifts such as high-pressure ridges that suppress cloud formation or low-pressure troughs that draw in moist air masses. Observers note that pressure gradients between adjacent areas drive wind acceleration according to the geostrophic balance equations, which become especially pronounced in mid-latitude ocean basins where temperature contrasts intensify during transitional seasons.
Recognizing Pressure Trends and Their Marine Implications
Steady falls of 2 to 3 millibars per hour frequently precede the arrival of warm fronts carrying increased cloud cover and precipitation, while steeper drops exceeding 5 millibars in the same interval correlate with intensifying low-pressure systems capable of generating gale-force winds. Conversely, rapid rises often follow the passage of cold fronts and indicate clearing conditions, although residual wave action may persist for several hours afterward. Studies from oceanographic institutes demonstrate that these patterns hold across both tropical cyclone approaches and extratropical storm development, allowing crews to cross-reference pressure logs with satellite imagery for refined timing estimates.
Local effects such as sea breezes or orographic lifting near coastlines can modulate baseline readings, so mariners combine instrument data with real-time reports from automated buoys maintained by agencies like the National Oceanic and Atmospheric Administration. In September 2026 seasonal monitoring programs are scheduled to expand buoy networks in the North Atlantic, providing denser datasets that researchers expect will improve short-term prediction accuracy for sudden squall lines.
Instrumentation and Data Integration Practices
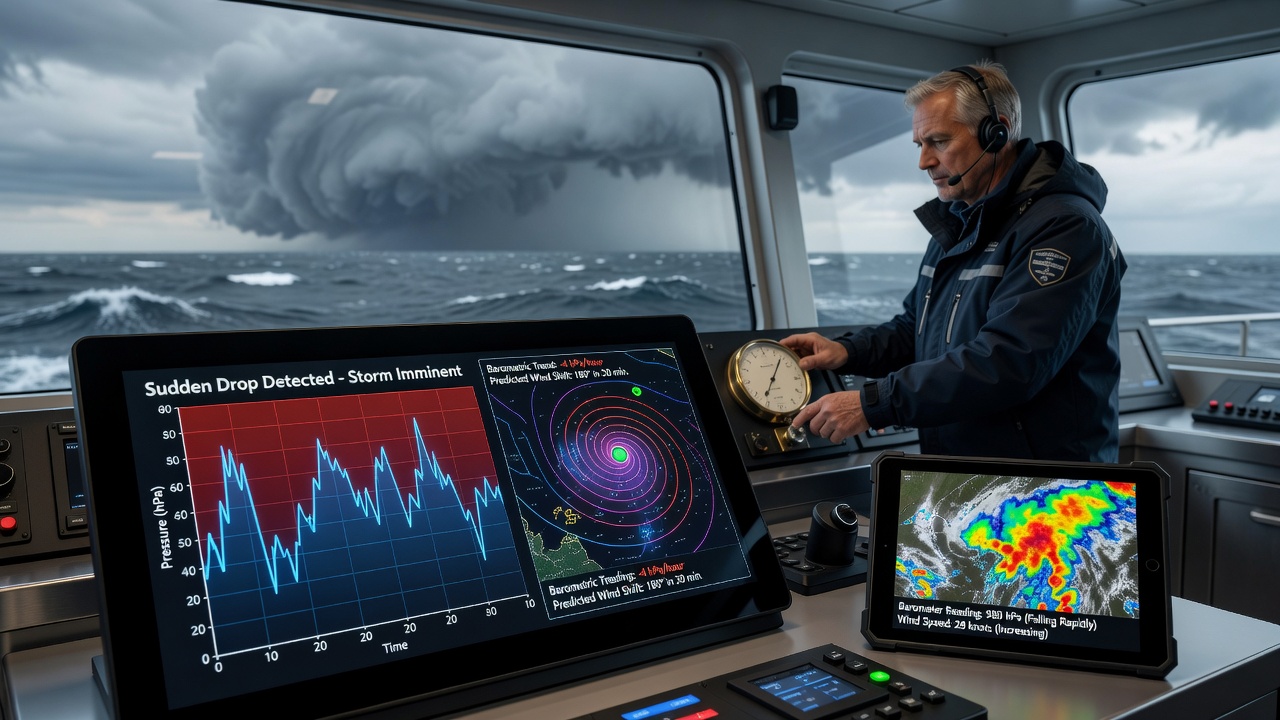
Traditional aneroid barometers remain standard aboard many vessels because they require no external power, yet electronic sensors paired with data loggers now deliver continuous trend analysis that reveals subtle accelerations in pressure change before they become obvious to the eye. Integration with onboard weather receivers allows automatic alerts when thresholds are crossed, and software packages convert raw readings into graphical histories that highlight inflection points. Those who operate long passages report that cross-checking multiple instruments reduces false positives caused by instrument lag or temperature-induced drift.
Training programs offered by maritime academies emphasize systematic logging intervals of 15 to 30 minutes during periods of heightened vigilance, creating records that feed into both immediate tactical decisions and post-voyage analysis. European meteorological services, including those coordinated through the European Centre for Medium-Range Weather Forecasts, supply ensemble model outputs that incorporate pressure tendency fields, enabling probabilistic assessments of rapid deterioration rather than single deterministic forecasts.
Case Examples from Recent Voyages
One documented transatlantic crossing recorded a 7-millibar drop over four hours that preceded a line of thunderstorms with embedded waterspouts, prompting the crew to reduce sail area well before visual cues appeared on the horizon. Another instance involved a gradual rise after a frontal passage that allowed planners to time a favorable wind shift for an efficient reach toward port. Such episodes illustrate how pressure decoding extends beyond isolated numbers to encompass rate-of-change calculations and contextual comparison with neighboring station reports.
Limitations and Complementary Indicators
Pressure alone cannot capture every localized phenomenon such as microbursts or sudden wind shifts driven by sea-surface temperature gradients, which is why forecasters recommend layering additional observations including swell period, visibility trends, and radar returns. Instrument calibration checks performed at regular intervals maintain accuracy, particularly after exposure to extreme temperature swings common in high-latitude routes. Data indicates that combining pressure analysis with satellite-derived sea-surface temperature maps improves detection of developing tropical disturbances during peak activity months.
Conclusion
Barometric pressure monitoring continues to function as a foundational element within marine weather strategies, supplying actionable lead time when interpreted alongside supporting datasets and modern instrumentation. Ongoing enhancements to observation networks scheduled through 2026 are expected to refine the resolution of these signals, supporting safer navigation across diverse ocean environments. Mariners who maintain disciplined logging and cross-verification practices gain measurable advantages in anticipating shifts that directly influence passage planning and onboard safety protocols.